Data on Australian’s social media trends is rare as hen’s teeth. Sensis is an Australian marketing services company, mining information through its digital consumer businesses: Yellow Pages, Whites Pages, True Local, Whereis, Skip. So when Sensis releases its annual report into how Australian people and businesses use social media, it’s always highly anticipated. This year was no exception.
With a sample group of 800 consumers and 1100 businesses, there were myriad insights to take away. Here’s a snapshot view of the key trends in this short video:
Here are the key facts that caught Mastermind’s attention:
Key consumer insights
- 87% of Australians access the internet daily and only a slight difference exists between metropolitan and non-metropolitan residents.
- Australians now spend more than half a day per week (12 hours) on Facebook alone – an increase of four hours from last year.
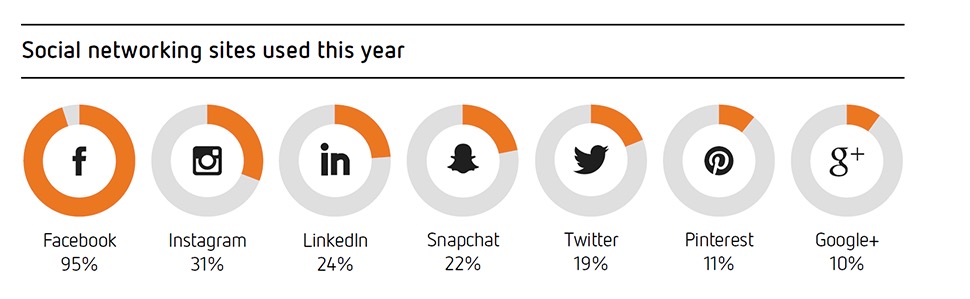
- Facebook maintains its ubiquitous appeal – it’s the most commonly used platform (up from 93% to 95%).
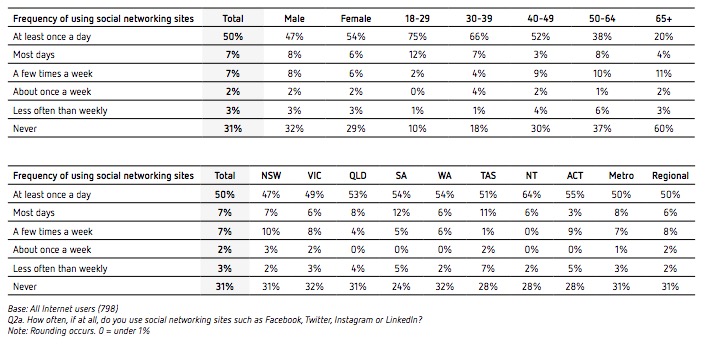
- On average, under 30-year-olds check in more than 40 times per week and the 65-plus age group check in over 11 times a week.
- Among the other platforms, Instagram is on a growth path, while LinkedIn was slightly less popular than it was in 2015. Interestingly, Twitter users appear to have increased marginally relative to 2015.
- Visual platforms like Instagram and Snapchat appeal mostly among the younger age groups.
- Instagram’s appeal is growing – almost doubling its reach since 2013 – capturing the interest of the younger demographic with 58% of 18-29-year-olds utilising.
- The appeal of social networking sites is strongest among females and under 40s. By location there was above average usage in SA, Tasmania and the territories.
- While social media is used throughout the day, usage in the evening, during work breaks and at lunchtime is higher this year, with a decline in use during work hours and last thing before bed. For both males and females, the evening is clearly the most popular time to use the platforms.
- 43% of 18-29 year olds use social media to watch videos. Females mentioned shopping and research-related reasons for using social media, while men follow celebrities, meet friends and meet people with the same interests.
- About one-third of social media users follow businesses or brands via social media – and there has been little variation in this finding since 2013. Exclusive offers have emerged as one of the more popular benefits for following brands.
- One-third of people are happy to see ads and over four in 10 people click on them occasionally to find out more. While the slight majority take no notice of ads, this number has declined from last year.
Key implications for business
- If your brand does not have an active presence on social media, your business is missing out – your customers are on the platform and it’s an ideal opportunity to engage. There’s been an upsurge in the number of businesses with a social media presence this year.
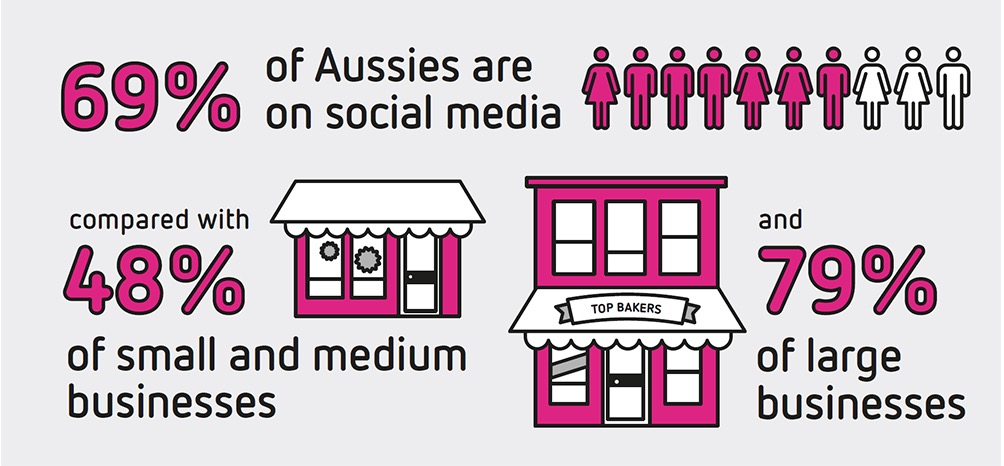
- So which businesses are on social media? Forty-eight percent of small businesses, 54% of medium-sized businesses and 79% of large businesses.
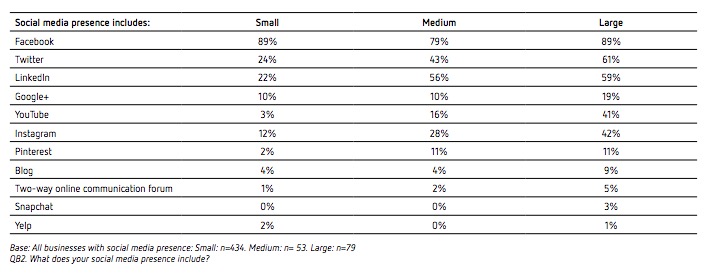
- The breakdown of social media platforms being used by businesses are as follows:
- For the first time, smartphones are the most popular devices owned by consumers, eclipsing laptops. This means that implementing a ‘mobile first’ strategy is imperative.
- Understand your demographics – younger people are using social media differently to the older generation, so producing one singular type of content and expecting it to resonate with all groups will no longer work.
- There was a reduction in the number of consumers reporting an expectation of benefits such as discounts, giveaways and coupons than two years ago – but tips and advice, exclusive offers and event invitations remain popular and brands should consider these as potential marketing tools.
- Those brands that interact with consumers in a positive way on social media engender more trust than those who don’t engage. Of those people asked, 41% agreed that they inspect a brand’s social media presence before making an online purchase if they had not purchased from the brand’s website before.
- Scheduling content to be posted during a period of time in which consumers are engaging online is important for success – increasing numbers of people report they do not use social media during work hours, so ensuring the content is relevant and timely is becoming more critical in a personal environment.
- Online blogs and reviews remain a fairly widespread influence on purchasing decisions, with 60% of social media users claiming to read content before making a purchase.
- The most likely location for businesses to advertise is on Facebook, with 8 out of ten SMBs and 9 out of 10 large businesses choosing to spend their advertising dollars on this platform. LinkedIn, Twitter and Instagram are all gaining traction as channels for advertising.
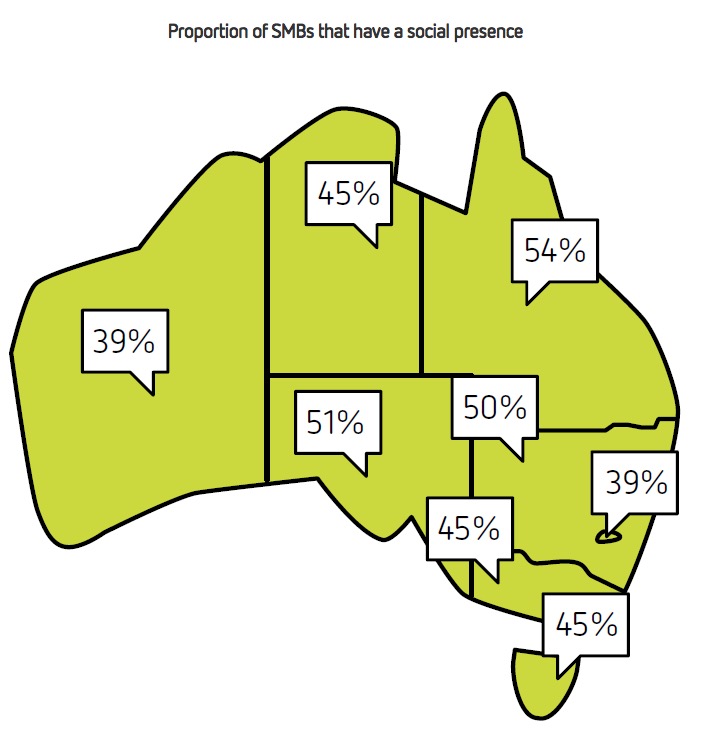
- There has been growth in every state and territory in terms of the number of SMBs with a social media presence this year. Queensland businesses lead the way (54%), while WA and ACT businesses (39%) are well behind.
- The main reason for people not following a company or brand on social media in the last three months is the publishing of irrelevant or unappealing content (52%). This is followed closely by too much content (32%). Now is the time to examine the content and ask whether the content being populated on these platforms is actually engaging.
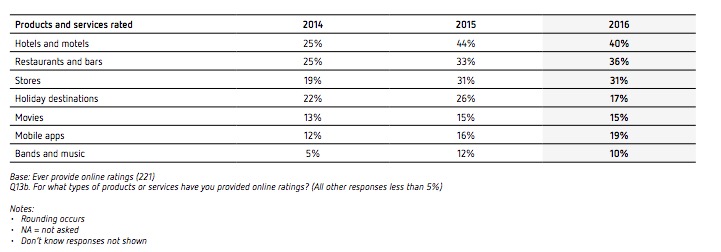
- Managing and responding to reviews is so important as consumers are embracing social media platforms as the vehicle to voice their concerns, particularly for restaurants and bars, hotels, motels and retail stores. The average number of reviews posted each year is 14, almost double the 2015 number of 8. If the business in question responds to a bad review, fewer believe this could change their opinion, 19% answered “yes” and 37% maybe.
- There’s huge scope for smaller businesses to improve awareness and customer interaction – less than half of SMBs, but more than ¾ of large businesses, invited customers to provide comments, ratings and reviews.
- Internal management of social media is more common than outsourcing for all business sizes. However, medium-sized businesses are beginning to outsource their social media, and specialist social media and communications teams are the preferred choice to manage.
- The budget allocation for social media in large businesses is now almost double the allocation of SMBs in percentage terms.
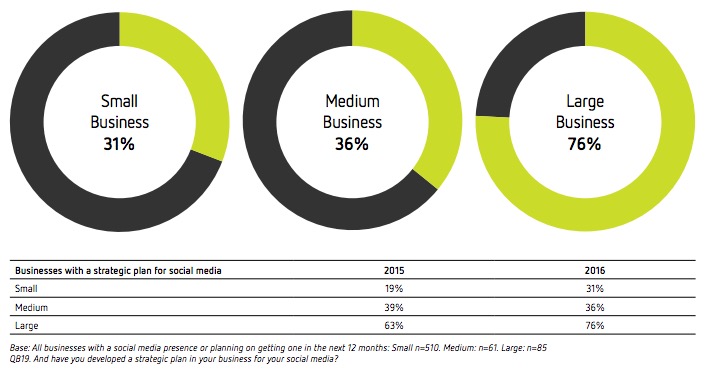
- There has been an improvement in the number of small businesses with a social media strategy (up from 19% to 31%) and three-quarters of large businesses have a strategy in place.
To view the full report, visit the Sensis website


